Wichtig
Übersetzen ist eine Gemeinschaftsleistung Sie können mitmachen. Diese Seite ist aktuell zu 50.00% übersetzt.
24.1.14. Plots
24.1.14.1. Bar plot
Creates a bar plot from a category and a layer field.
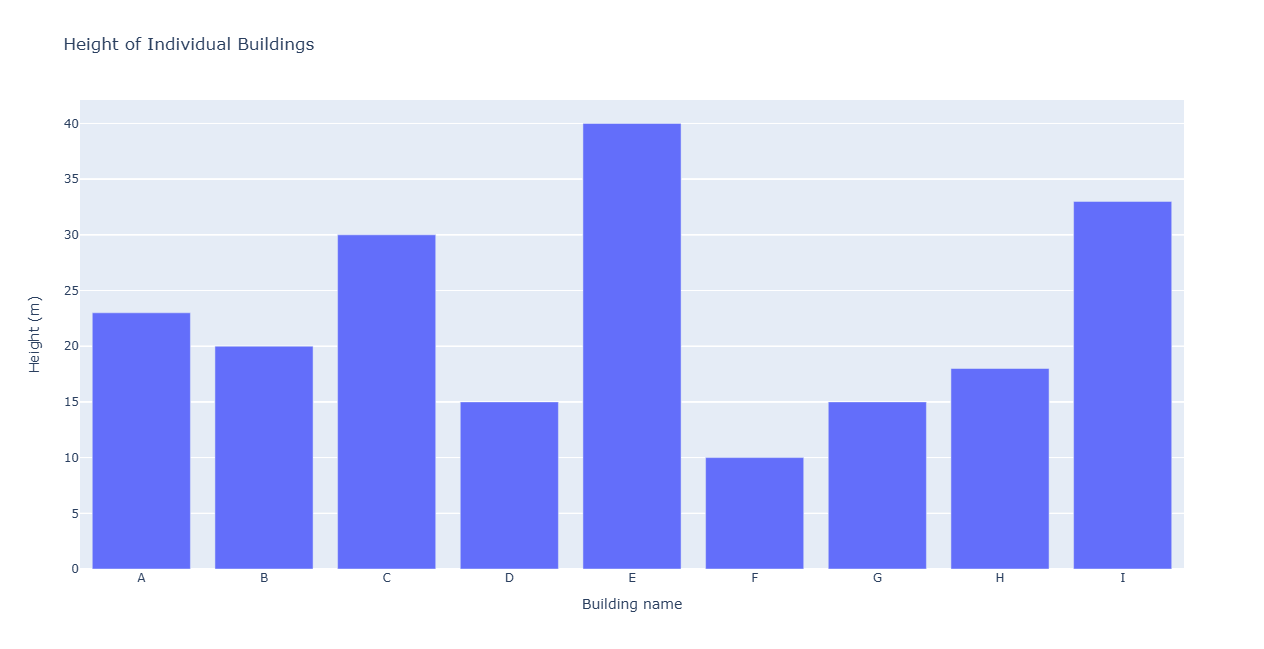
Abb. 24.32 Bar plot example
Parameter
Bezeichnung |
Name |
Typ |
Beschreibung |
|---|---|---|---|
Eingabelayer |
|
[Vektor: Geometrie] |
Eingabe-Vektorlayer |
Category field name |
|
[tablefield: any] |
Categorical field to use for grouping the bars (X axis) |
Value field |
|
[tablefield: numeric] |
Value to use for the plot (Y axis). |
Title Optional
|
|
[Text] Default: „“ |
Title of the plot |
X-axis Title Optional
|
|
[Text] Default: „“ |
If empty, the name of the category field is used. With a single space, the axis title is hidden. |
Y-axis Title Optional
|
|
[Text] Default: „“ |
If empty, the name of the value field is used. With a single space, the axis title is hidden. |
Bar plot |
|
[html] Standard: |
Specify the HTML file for the plot. One of:
|
Ausgaben
Bezeichnung |
Name |
Typ |
Beschreibung |
|---|---|---|---|
Bar plot |
|
[html] |
HTML file with the plot. Available in the . |
Python-Code
Algorithm ID: qgis:barplot
import processing
processing.run("algorithm_id", {parameter_dictionary})
Die Algorithmus-Kennung wird angezeigt, wenn Sie den Mauszeiger über den Algorithmus in der Verarbeitungs-Werkzeugkiste bewegen. Die Parameter-Liste (parameter_dictionary) enthält die Namen und Werte der Parameter. Siehe Verarbeitungs-Algorithmen von der Konsole aus verwenden für Details zur Ausführung von Verarbeitungsalgorithmen über die Python-Konsole.
24.1.14.2. Box plot
Creates a box plot from a category field and a numerical layer field.
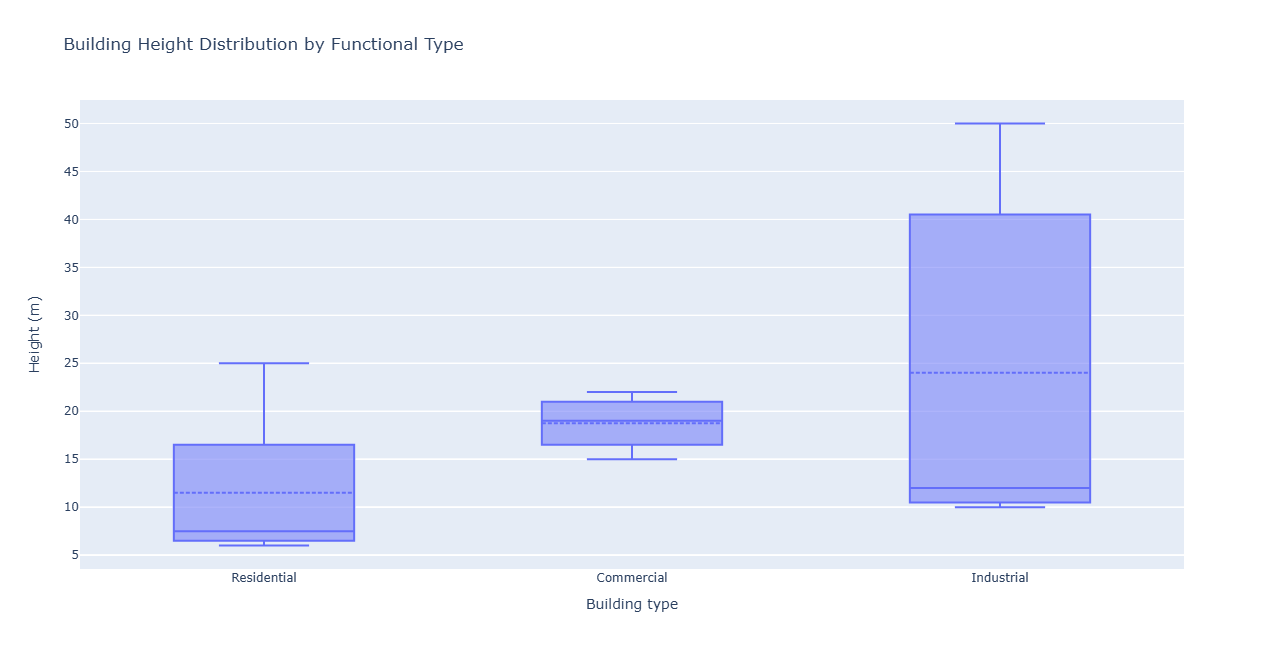
Abb. 24.33 Example of box plot
Parameter
Bezeichnung |
Name |
Typ |
Beschreibung |
|---|---|---|---|
Eingabelayer |
|
[Vektor: Geometrie] |
Eingabe-Vektorlayer |
Category name field |
|
[tablefield: any] |
Categorical field to use for grouping the boxes (X axis) |
Value field |
|
[tablefield: numeric] |
Value to use for the plot (Y axis). |
Additional statistic lines |
|
[Aufzählung] Standard: 0 |
Additional statistics information to add to the plot. One of:
|
Title Optional
|
|
[Text] Default: „“ |
Title of the plot |
X-axis Title Optional
|
|
[Text] Default: „“ |
If empty, the name of the category field is used. With a single space, the axis title is not shown. |
Y-axis Title Optional
|
|
[Text] Default: „“ |
If empty, the name of the value field is used. With a single space, the axis title is not shown. |
Box plot |
|
[html] Standard: |
Specify the HTML file for the plot. One of:
|
Ausgaben
Bezeichnung |
Name |
Typ |
Beschreibung |
|---|---|---|---|
Box plot |
|
[html] |
HTML file with the plot. Available in the . |
Python-Code
Algorithm ID: qgis:boxplot
import processing
processing.run("algorithm_id", {parameter_dictionary})
Die Algorithmus-Kennung wird angezeigt, wenn Sie den Mauszeiger über den Algorithmus in der Verarbeitungs-Werkzeugkiste bewegen. Die Parameter-Liste (parameter_dictionary) enthält die Namen und Werte der Parameter. Siehe Verarbeitungs-Algorithmen von der Konsole aus verwenden für Details zur Ausführung von Verarbeitungsalgorithmen über die Python-Konsole.
24.1.14.3. Generate elevation profile image
Added in 3.42
Creates an elevation profile image from a list of map layers and an optional terrain layer.
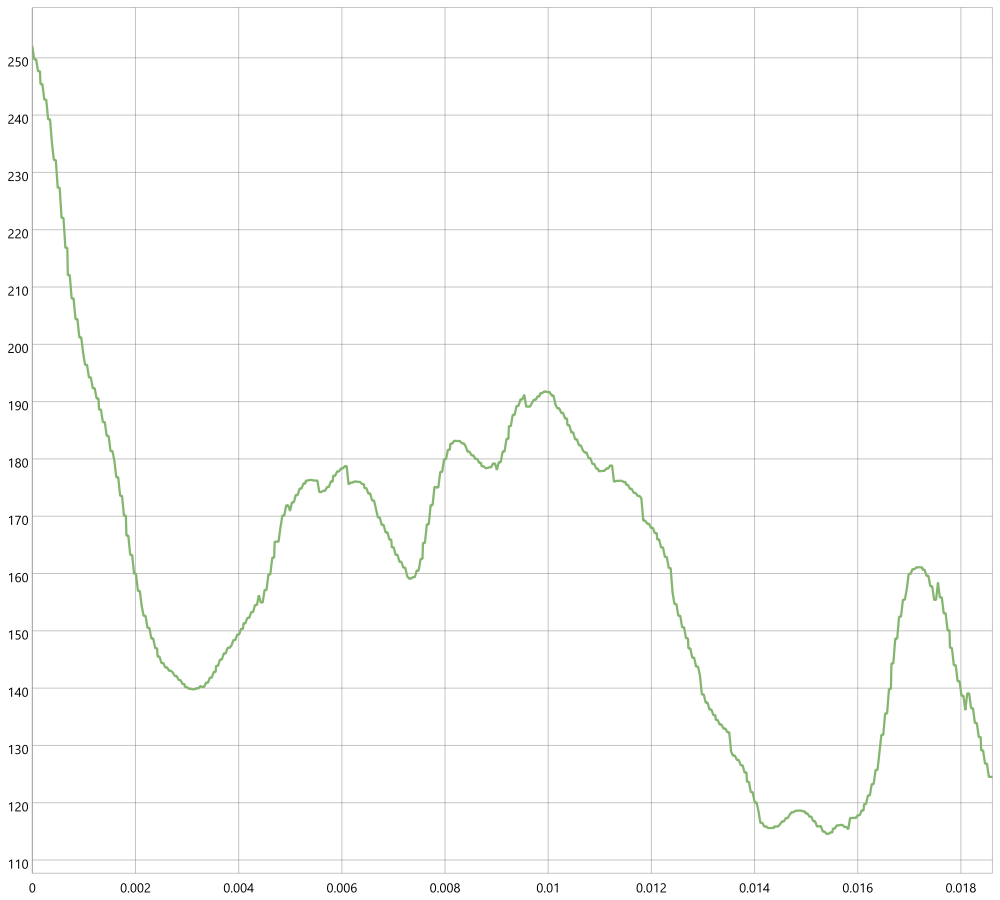
Abb. 24.34 Example of elevation profile
Parameter
Grundlegende Parameter
Bezeichnung |
Name |
Typ |
Beschreibung |
|---|---|---|---|
Profile curve |
|
[geometry: line] |
The LineString geometry (WKT or GeoJSON) representing the profile curve along which the elevation profile will be generated |
Map layers |
|
[layer] [list] |
The list of map layers to include in the elevation profile |
Chart width (in pixels) |
|
[numerisch: Ganzzahl] Default: 400 Minimum value: 0 |
The width of the output chart in pixels. |
Chart height (in pixels) |
|
[numerisch: Ganzzahl] Default: 300 Minimum value: 0 |
The height of the output chart in pixels. |
Terrain layer Optional |
|
[Raster] |
A terrain layer (e.g., DEM) to use for elevation data. If not provided, elevation data will be derived from the map layers. |
Fortgeschrittene Parameter
Bezeichnung |
Name |
Typ |
Beschreibung |
|---|---|---|---|
Chart minimum distance (X axis) Optional |
|
[numerisch: Double] |
The minimum distance (X axis) to display on the chart. If not specified, the chart will auto-scale. |
Chart maximum distance (X axis) Optional |
|
[numerisch: Double] |
The maximum distance (X axis) to display on the chart. If not specified, the chart will auto-scale. |
Chart minimum elevation (Y axis) Optional |
|
[numerisch: Double] |
The minimum elevation (Y axis) to display on the chart. If not specified, the chart will auto-scale. |
Chart maximum elevation (Y axis) Optional |
|
[numerisch: Double] |
The maximum elevation (Y axis) to display on the chart. If not specified, the chart will auto-scale. |
Chart text color Optional |
|
[color] |
The color of the text in the chart (e.g., axis labels, titles). |
Chart background color Optional |
|
[color] |
The background color of the chart. |
Chart border color Optional |
|
[color] |
The color of the chart border. |
Profile tolerance |
|
[numerisch: Double] Default: 5.0 Minimum value: 0 |
Defines how far a feature (vector point, line, polygon, or point cloud) can be from the profile line to be included in the results. It uses map units and does not affect other layer types. |
Chart DPI |
|
[numerisch: Ganzzahl] Default: 96 Minimum value: 0 |
The resolution of the output image in dots per inch (DPI). |
Output image |
|
[Datei] Standard: |
Specify the image file for the plot. One of:
|
Ausgaben
Bezeichnung |
Name |
Typ |
Beschreibung |
|---|---|---|---|
Output image |
|
[Datei] |
The generated elevation profile image in the specified format. |
Python-Code
Algorithm ID: native:generateelevationprofileimage
import processing
processing.run("algorithm_id", {parameter_dictionary})
Die Algorithmus-Kennung wird angezeigt, wenn Sie den Mauszeiger über den Algorithmus in der Verarbeitungs-Werkzeugkiste bewegen. Die Parameter-Liste (parameter_dictionary) enthält die Namen und Werte der Parameter. Siehe Verarbeitungs-Algorithmen von der Konsole aus verwenden für Details zur Ausführung von Verarbeitungsalgorithmen über die Python-Konsole.
24.1.14.4. Mean and standard deviation plot
Creates a box plot with mean and standard deviation values.
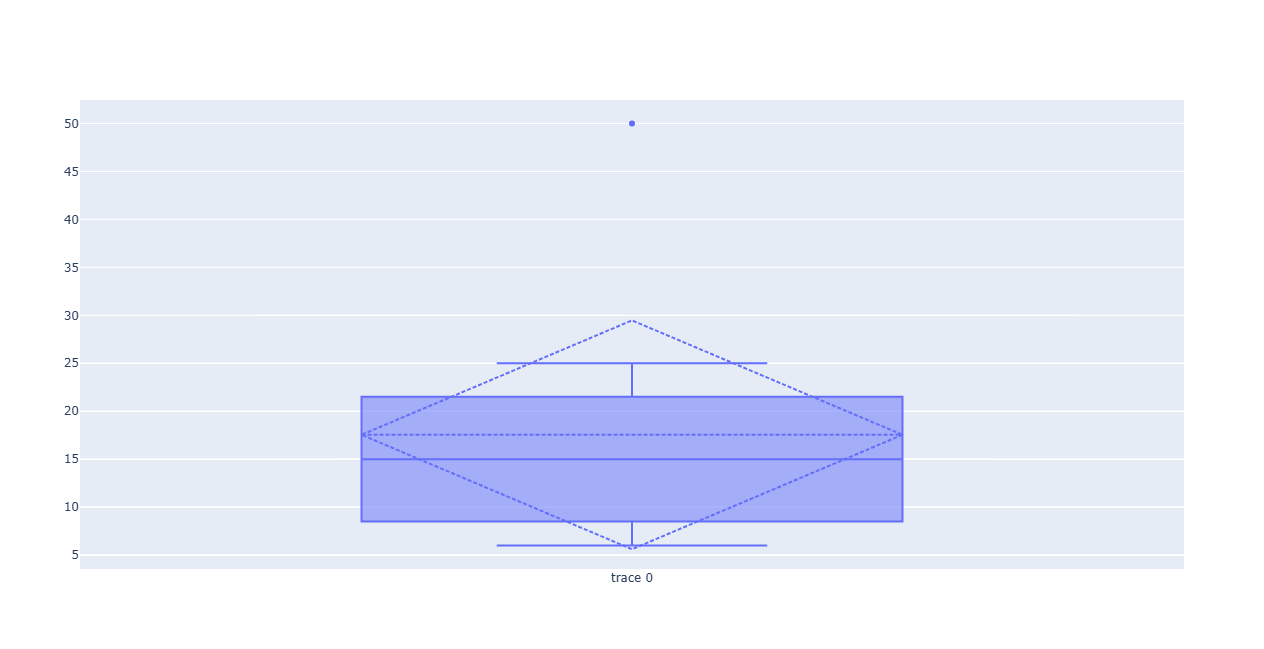
Abb. 24.35 Example of mean and standard deviation plot
Parameter
Bezeichnung |
Name |
Typ |
Beschreibung |
|---|---|---|---|
Input table |
|
[Vektor: Geometrie] |
Eingabe-Vektorlayer |
Category name field |
|
[tablefield: any] |
Categorical field to use for grouping the boxes (X axis) |
Value field |
|
[tablefield: numeric] |
Value to use for the plot (Y axis). |
Plot |
|
[html] Standard: |
Specify the HTML file for the plot. One of:
|
Ausgaben
Bezeichnung |
Name |
Typ |
Beschreibung |
|---|---|---|---|
Plot |
|
[html] |
HTML file with the plot. Available in the . |
Python-Code
Algorithm ID: qgis:meanandstandarddeviationplot
import processing
processing.run("algorithm_id", {parameter_dictionary})
Die Algorithmus-Kennung wird angezeigt, wenn Sie den Mauszeiger über den Algorithmus in der Verarbeitungs-Werkzeugkiste bewegen. Die Parameter-Liste (parameter_dictionary) enthält die Namen und Werte der Parameter. Siehe Verarbeitungs-Algorithmen von der Konsole aus verwenden für Details zur Ausführung von Verarbeitungsalgorithmen über die Python-Konsole.
24.1.14.5. Polar plot
Generates a polar plot based on the value of an input vector layer.
Two fields must be entered as parameters: one that defines the category each feature (to group features) and another one with the variable to plot (this has to be a numeric one).
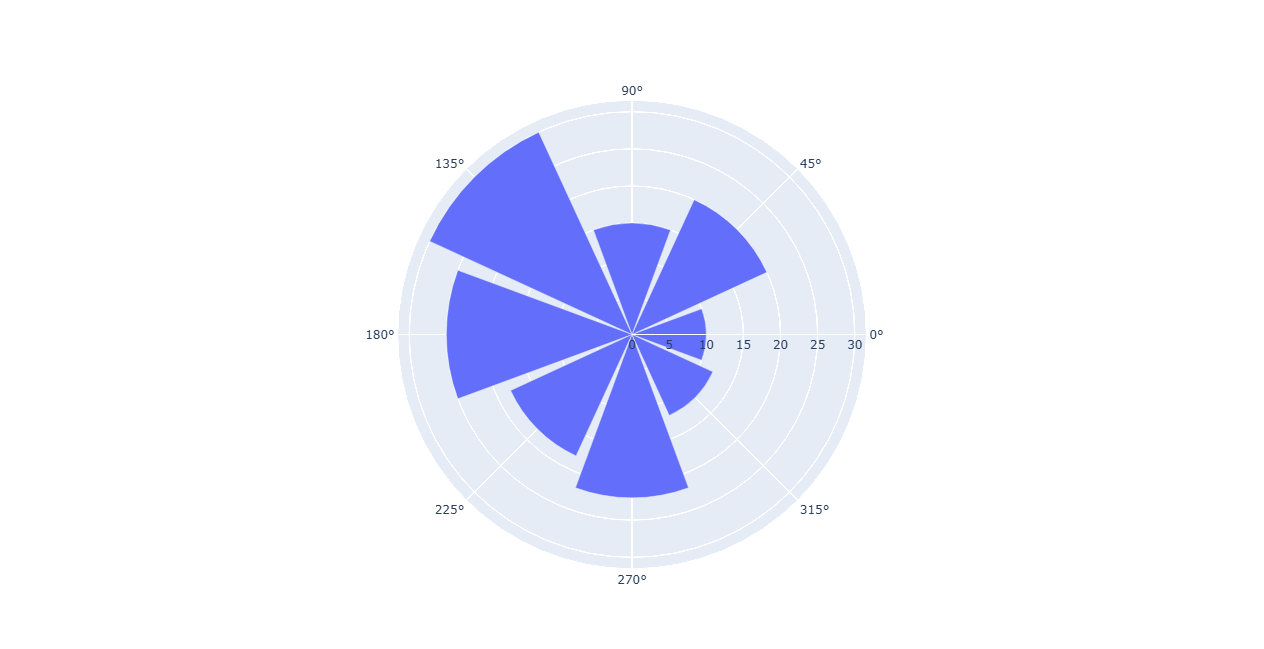
Abb. 24.36 Example of polar plot
Parameter
Bezeichnung |
Name |
Typ |
Beschreibung |
|---|---|---|---|
Eingabelayer |
|
[Vektor: Geometrie] |
Eingabe-Vektorlayer |
Category name field |
|
[tablefield: any] |
Categorical field to use for grouping the features (X axis) |
Value field |
|
[tablefield: numeric] |
Value to use for the plot (Y axis). |
Polar plot |
|
[html] Standard: |
Specify the HTML file for the plot. One of:
|
Ausgaben
Bezeichnung |
Name |
Typ |
Beschreibung |
|---|---|---|---|
Polar plot |
|
[html] |
HTML file with the plot. Available in the . |
Python-Code
Algorithm ID: qgis:polarplot
import processing
processing.run("algorithm_id", {parameter_dictionary})
Die Algorithmus-Kennung wird angezeigt, wenn Sie den Mauszeiger über den Algorithmus in der Verarbeitungs-Werkzeugkiste bewegen. Die Parameter-Liste (parameter_dictionary) enthält die Namen und Werte der Parameter. Siehe Verarbeitungs-Algorithmen von der Konsole aus verwenden für Details zur Ausführung von Verarbeitungsalgorithmen über die Python-Konsole.
24.1.14.6. Raster layer histogram
Generates a histogram with the values of a raster layer.
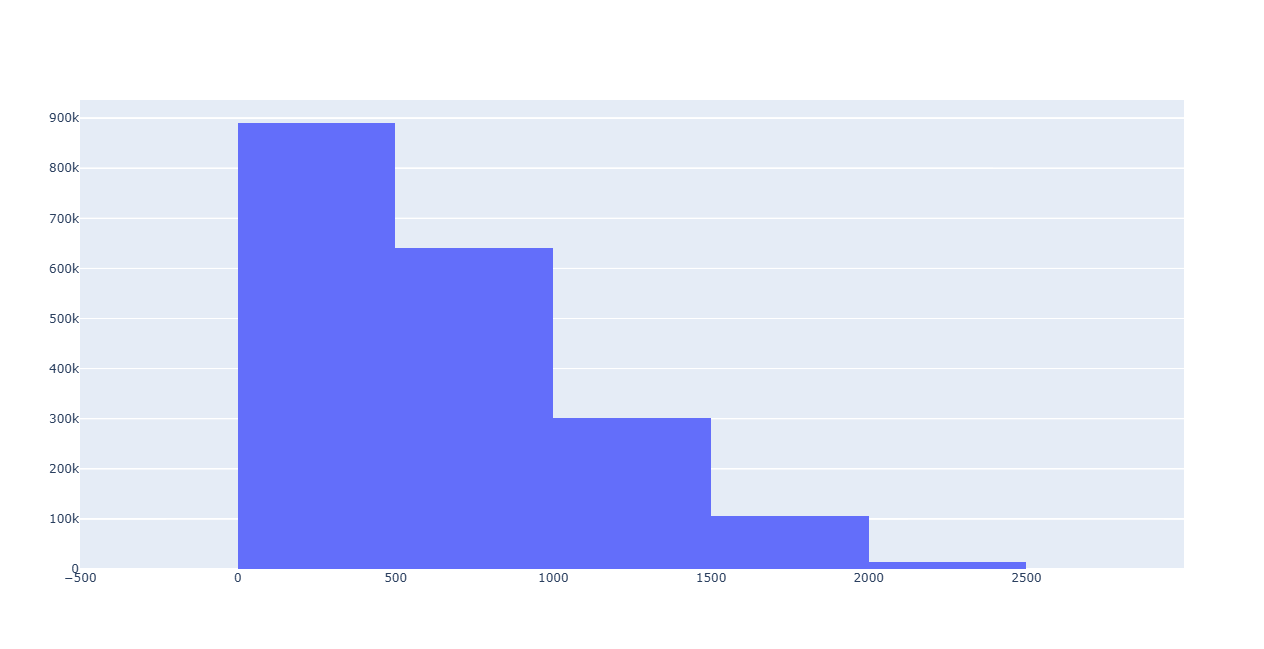
Abb. 24.37 Raster layer histogram example
Parameter
Bezeichnung |
Name |
Typ |
Beschreibung |
|---|---|---|---|
Eingabelayer |
|
[Raster] |
Input raster layer |
Band number |
|
[raster band] |
Raster band to use for the histogram |
number of bins |
|
[numerisch: Ganzzahl] Default: 10 |
The number of bins to use in the histogram (X axis). Minimum 2. |
Histogram |
|
[html] Standard: |
Specify the HTML file for the plot. One of:
|
Ausgaben
Bezeichnung |
Name |
Typ |
Beschreibung |
|---|---|---|---|
Histogram |
|
[html] |
HTML file with the plot. Available in the . |
Python-Code
Algorithm ID: qgis:rasterlayerhistogram
import processing
processing.run("algorithm_id", {parameter_dictionary})
Die Algorithmus-Kennung wird angezeigt, wenn Sie den Mauszeiger über den Algorithmus in der Verarbeitungs-Werkzeugkiste bewegen. Die Parameter-Liste (parameter_dictionary) enthält die Namen und Werte der Parameter. Siehe Verarbeitungs-Algorithmen von der Konsole aus verwenden für Details zur Ausführung von Verarbeitungsalgorithmen über die Python-Konsole.
24.1.14.7. Vector layer histogram
Generates a histogram with the values of the attribute of a vector layer.
The attribute to use for computing the histogram must be numeric.
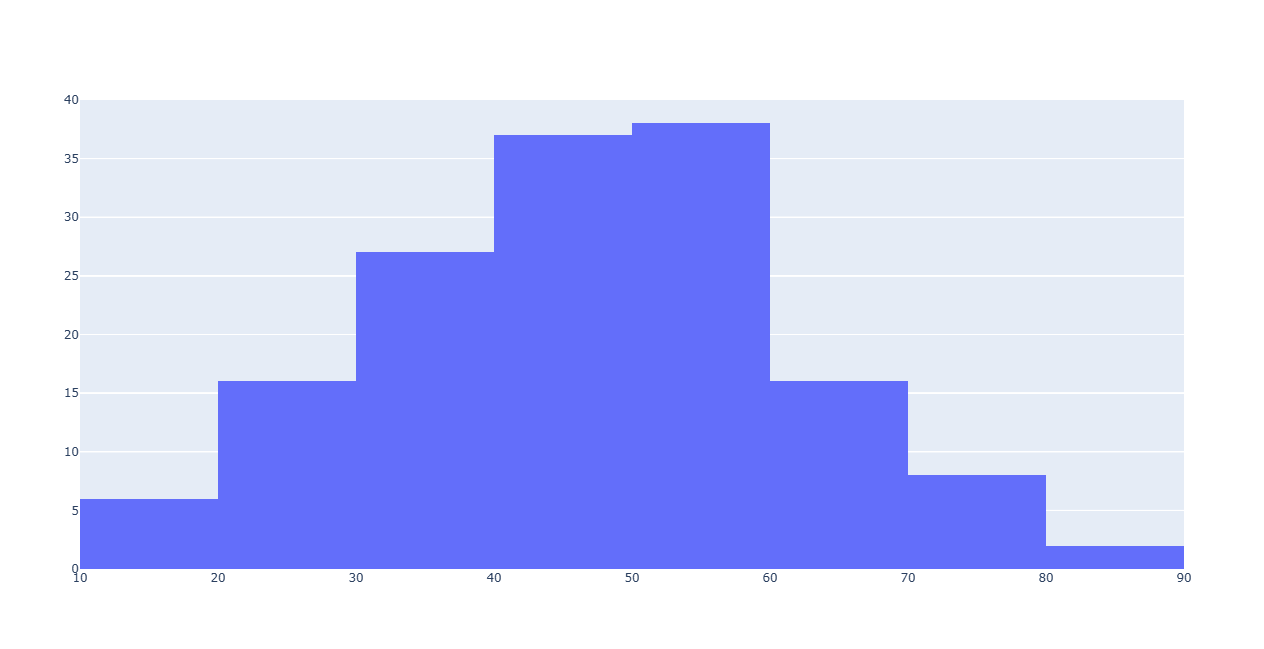
Abb. 24.38 Example of vector layer histogram
Parameter
Bezeichnung |
Name |
Typ |
Beschreibung |
|---|---|---|---|
Eingabelayer |
|
[Vektor: alle] |
Eingabe-Vektorlayer |
Attribut |
|
[tablefield: numeric] |
Value to use for the plot (Y axis). |
number of bins |
|
[numerisch: Ganzzahl] Default: 10 |
The number of bins to use in the histogram (X axis). Minimum 2. |
Histogram |
|
[html] Standard: |
Specify the HTML file for the plot. One of:
|
Ausgaben
Bezeichnung |
Name |
Typ |
Beschreibung |
|---|---|---|---|
Histogram |
|
[html] |
HTML file with the plot. Available in the . |
Python-Code
Algorithm ID: qgis:vectorlayerhistogram
import processing
processing.run("algorithm_id", {parameter_dictionary})
Die Algorithmus-Kennung wird angezeigt, wenn Sie den Mauszeiger über den Algorithmus in der Verarbeitungs-Werkzeugkiste bewegen. Die Parameter-Liste (parameter_dictionary) enthält die Namen und Werte der Parameter. Siehe Verarbeitungs-Algorithmen von der Konsole aus verwenden für Details zur Ausführung von Verarbeitungsalgorithmen über die Python-Konsole.
24.1.14.8. Vector layer scatterplot
Creates a simple X - Y scatter plot for a vector layer.
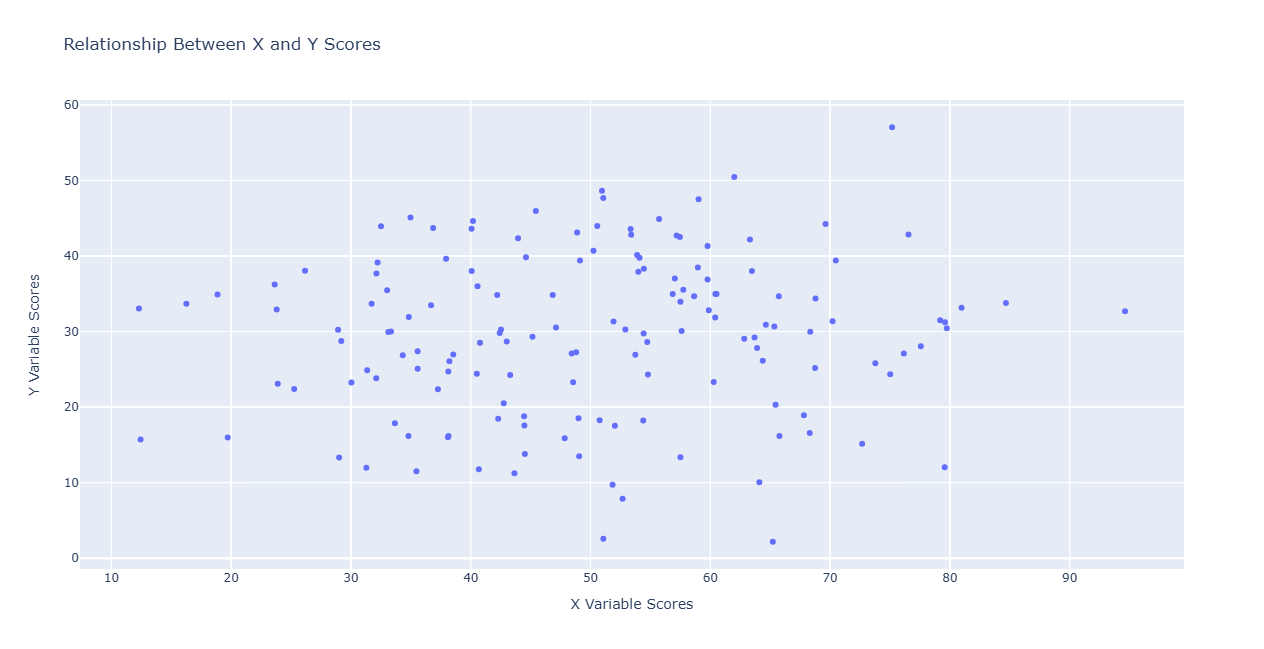
Abb. 24.39 Example of vector layer scatterplot
Parameter
Bezeichnung |
Name |
Typ |
Beschreibung |
|---|---|---|---|
Eingabelayer |
|
[Vektor: Geometrie] |
Eingabe-Vektorlayer |
X attribute |
|
[tablefield: numeric] |
Field to use for the X axis |
Y attribute |
|
[tablefield: numeric] |
Field to use for the Y axis |
Hover text Optional
|
|
[Ausdruck] Default: „“ |
Text to be shown when hovering with the mouse over data points. It can be picked from a field or based on an expression. |
Title Optional
|
|
[Text] Default: „“ |
Title of the plot |
X-axis Title Optional
|
|
[Text] Default: „“ |
If empty, the field name of the x attribute is used. With a single space, the axis title is not shown. |
Y-axis Title Optional
|
|
[Text] Default: „“ |
If empty, the field name of the y attribute is used. With a single space, the axis title is not shown. |
Use logarithmic scale for x-axis
|
|
[Boolean] Standard: falsch |
When enabled, uses logarithmic scale for the x-axis |
Use logarithmic scale for y-axis
|
|
[Boolean] Standard: falsch |
When enabled, uses logarithmic scale for the y-axis |
Scatterplot |
|
[html] Standard: |
Specify the HTML file for the plot. One of:
|
Ausgaben
Bezeichnung |
Name |
Typ |
Beschreibung |
|---|---|---|---|
Scatterplot |
|
[html] |
HTML file with the plot. Available in the . |
Python-Code
Algorithm ID: qgis:vectorlayerscatterplot
import processing
processing.run("algorithm_id", {parameter_dictionary})
Die Algorithmus-Kennung wird angezeigt, wenn Sie den Mauszeiger über den Algorithmus in der Verarbeitungs-Werkzeugkiste bewegen. Die Parameter-Liste (parameter_dictionary) enthält die Namen und Werte der Parameter. Siehe Verarbeitungs-Algorithmen von der Konsole aus verwenden für Details zur Ausführung von Verarbeitungsalgorithmen über die Python-Konsole.
24.1.14.9. Vector layer scatterplot 3D
Creates a 3D scatter plot for a vector layer.
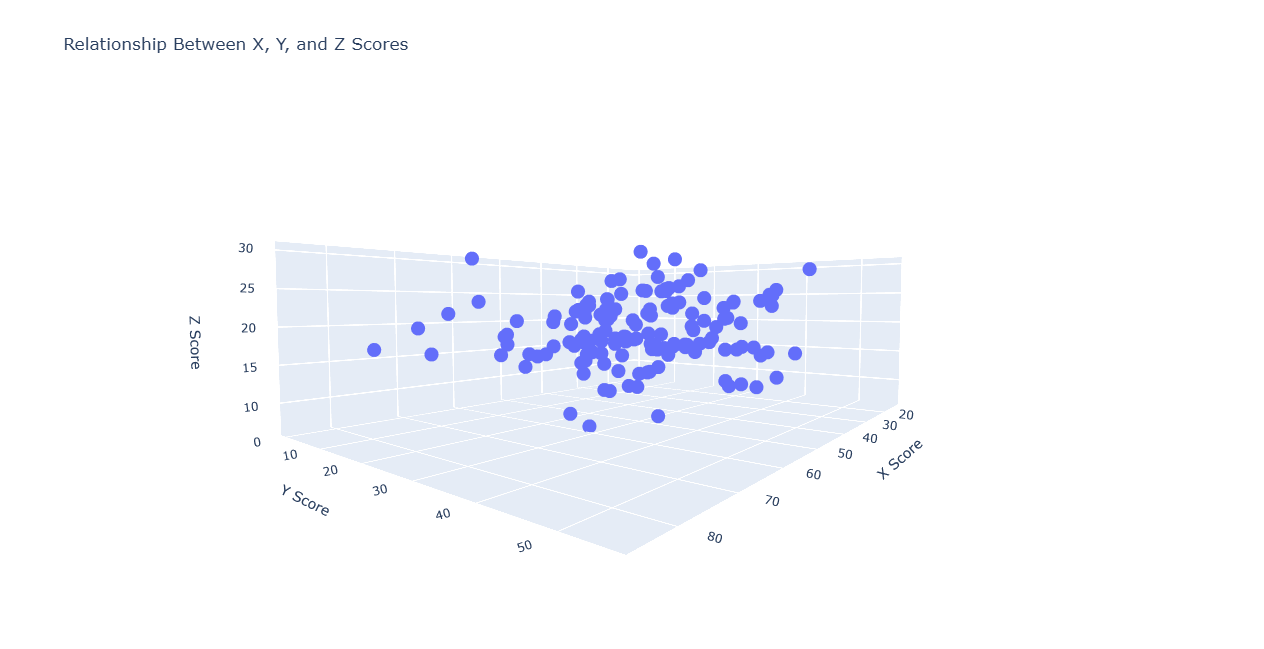
Abb. 24.40 Example of 3D scatter plot
Parameter
Bezeichnung |
Name |
Typ |
Beschreibung |
|---|---|---|---|
Eingabelayer |
|
[Vektor: Geometrie] |
Eingabe-Vektorlayer |
X attribute |
|
[tablefield: numeric] |
Field to use for the X axis |
Y attribute |
|
[tablefield: numeric] |
Field to use for the Y axis |
Z attribute |
|
[tablefield: numeric] |
Field to use for the Z axis |
Title Optional
|
|
[Text] Default: „“ |
Title of the plot |
X-axis Title Optional
|
|
[Text] Default: „“ |
If empty, the field name of the X attribute is used. |
Y-axis Title Optional
|
|
[Text] Default: „“ |
If empty, the field name of the Y attribute is used. |
Z-axis Title Optional
|
|
[Text] Default: „“ |
If empty, the field name of the Z attribute is used. |
Scatterplot 3D |
|
[html] Standard: |
Specify the HTML file for the plot. One of:
|
Ausgaben
Bezeichnung |
Name |
Typ |
Beschreibung |
|---|---|---|---|
Scatterplot 3D |
|
[html] |
HTML file with the plot. Available in the . |
Python-Code
Algorithm ID: qgis:scatter3dplot
import processing
processing.run("algorithm_id", {parameter_dictionary})
Die Algorithmus-Kennung wird angezeigt, wenn Sie den Mauszeiger über den Algorithmus in der Verarbeitungs-Werkzeugkiste bewegen. Die Parameter-Liste (parameter_dictionary) enthält die Namen und Werte der Parameter. Siehe Verarbeitungs-Algorithmen von der Konsole aus verwenden für Details zur Ausführung von Verarbeitungsalgorithmen über die Python-Konsole.