20. Preparing Exercise Data
Important
This process is intended for course conveners, or more experienced QGIS users who wish to create localised sample data sets for their course. Default data sets are provided with the Training Manual, but you may follow these instructions if you wish to replace the default data sets.
The sample data provided with the Training Manual refers to the town of Swellendam and its surroundings. Swellendam is located about 2 hours’ east of Cape Town in the Western Cape of South Africa. The dataset contains feature names in both English and Afrikaans.
Anyone can use this dataset without difficulty, but you may prefer to use data from your own country or home town. If you choose to do so, your localised data will be used in all lessons from Module 3 to Module 7.2. Later modules use more complex data sources which may or may not be available for your region.
Note
These instructions assume you have a good knowledge of QGIS and are not intended to be used as teaching material.
20.1. Create OSM based vector files
If you wish to replace the default data set with localised data for your course, this can easily be done with tools built into QGIS. The region you choose to use should have a good mix of urban and rural areas, containing roads of differing significance, area boundaries (such as nature reserves or farms) and surface water, such as streams and rivers.
Open a new QGIS project
Select to open the Data Source Manager dialog
In the Browser tab, expand the XYZ Tiles drop-down menu and double-click the OpenStreetMap item.
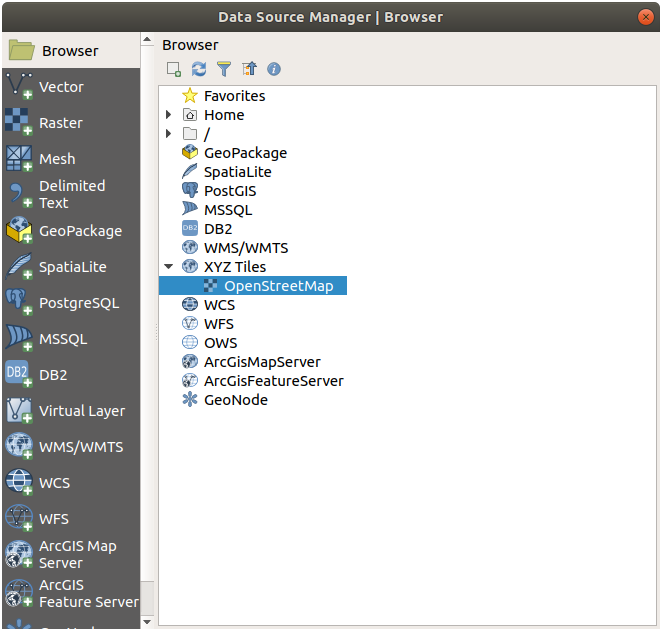
A map of the world is now visible on the map canvas.
Close the Data Source Manager dialog
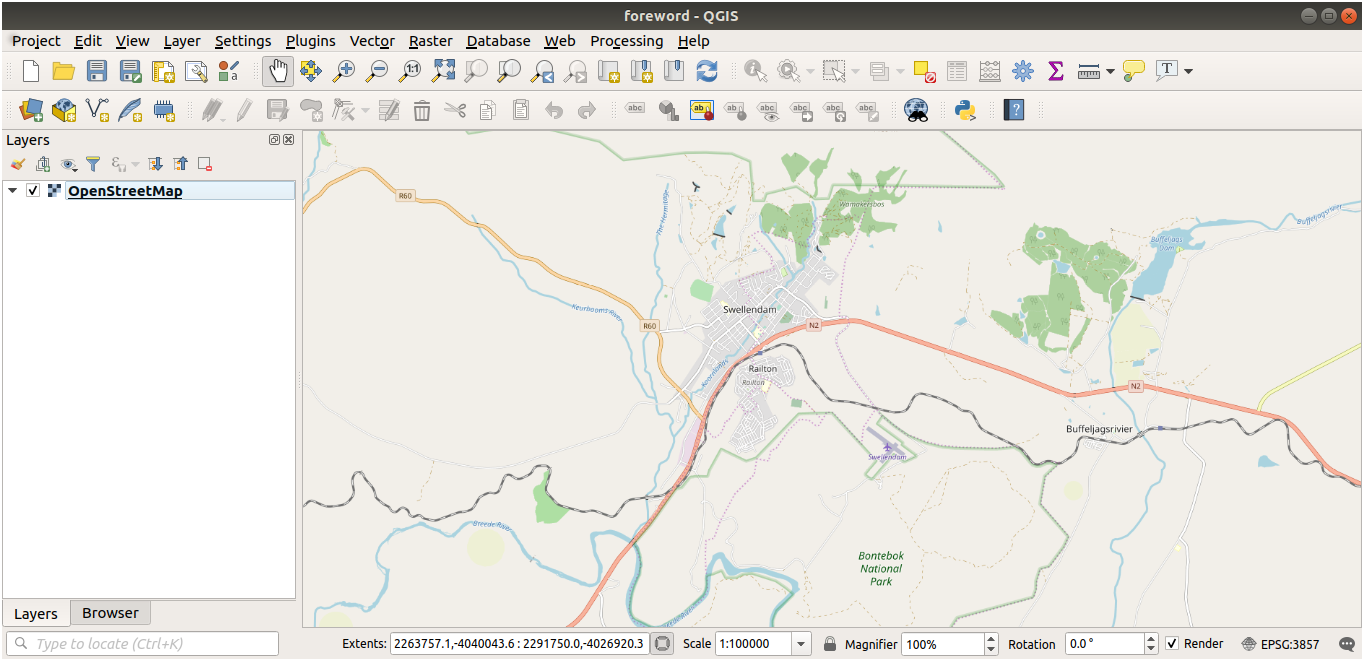
Move to the area you’d like to use as study area
Now that we have the area we’ll extract the data from, let’s enable the extraction tools.
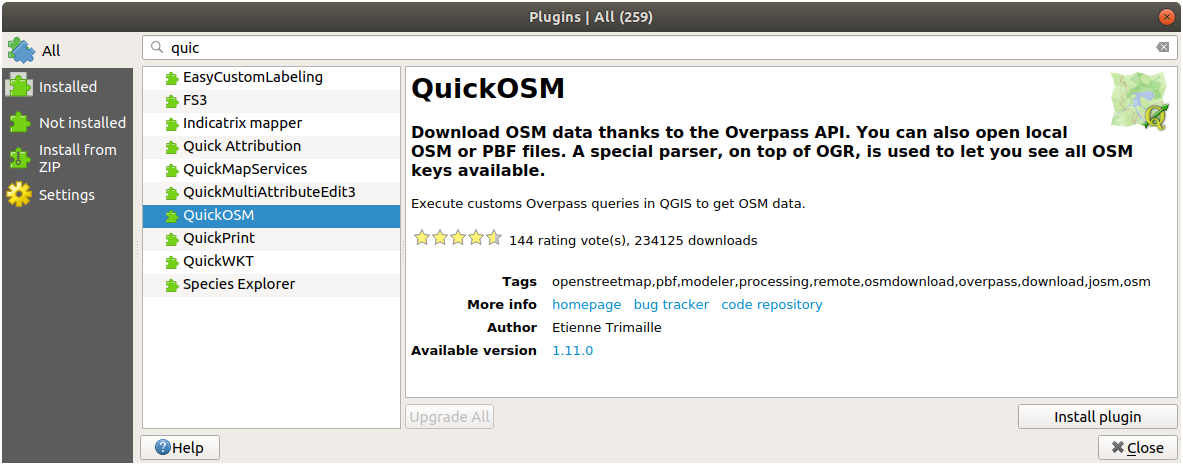
Go to
In the All tab, type
QuickOSMin the search boxSelect the QuickOSM plugin, press Install Plugin and then Close the dialog.
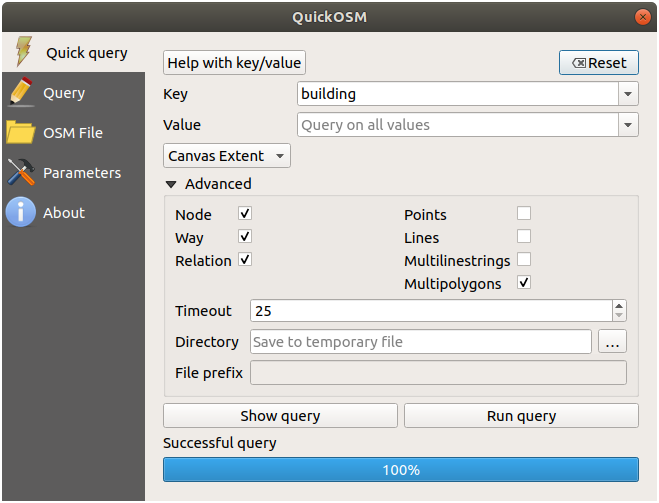
Execute the new plugin from menu
In the Quick query tab, select
buildingin the Key drop-down menuLeave the Value field empty, meaning that you are querying all buildings.
Select Canvas Extent in the next drop-down menu
Expand the Advanced group below and uncheck all geometry types on the right except Multipolygons.
Press Run query
A new
buildinglayer is added to the Layers panel, showing buildings in the selected extent.Proceed as above to extract other data:
Key = landuseandMultipolygonsgeometry type.Key = boundary,Value = protected_areaandMultipolygonsgeometry type.Key = natural,Value = waterandMultipolygonsgeometry type.Key = highwayand checkLinesandMultilinesgeometry types.Key = waterway,Value = riverand checkLinesandMultilinesgeometry types.Key = placeandPointsgeometry type.
This process adds the layers as temporary files (indicated by the
 icon next to their name).
You can sample the data your region contains in order to see what kind of results your region will yield.
We now need to save the resulting data to use during your course. We’ll be using ESRI Shapefile, GeoPackage and SpatiaLite formats depending on the data.
To convert the place temporary layer to another format:
Click the
icon next to the place layer
to open the Save Scratch Layer dialog.Note
If you need to change any of the temporary layer’s properties (CRS, extent, fields…), use the contextual menu instead, and ensure the Add saved file to map option is checked. This adds a new layer.
Select the ESRI Shapefile format
Use the … button to browse to the
exercise_data/shapefile/folder and save the file asplaces.shp.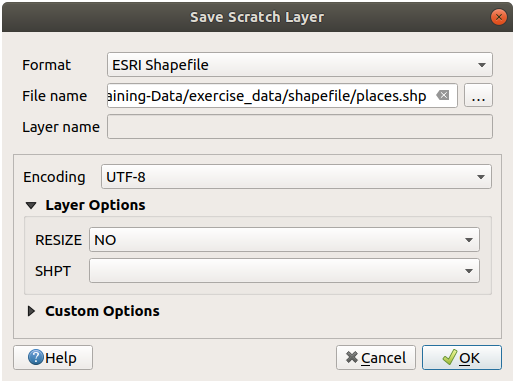
Press OK
In the Layers panel, the temporary place layer is replaced with the saved places shapefile layer and the temporary icon next to it removed.
Double-click the layer to open its tab and update the Layer name property to match the file name.
Repeat the process for other layers, renaming them as follows:
natural_waterintowaterwaterway_riverintoriversboundary_protected_areaintoprotected_areas
Each resulting data set should be saved in the
exercise_data/shapefile/directory.
The next step is to create a GeoPackage file from the building layer to use during the course:
Click the
icon next to the building layerSelect the GeoPackage format
Save the file as
training_data.gpkgunder theexercise_data/folderBy default, the Layer name is filled as the file name. Replace it with
buildings.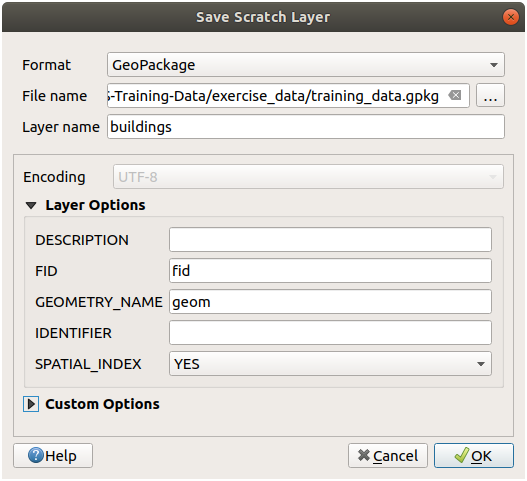
Press OK
Rename the layer in its properties dialog
Repeat the process with the highway layer, saving it as
roadsin the same GeoPackage database.
The last step is to save the remaining temporary file as a SpatiaLite file.
Click the
icon next to the landuse layerSelect the SpatiaLite format
Save the file as
landuse.sqliteunder theexercise_data/folder. By default, the Layer name is filled as the file name. Do not change it.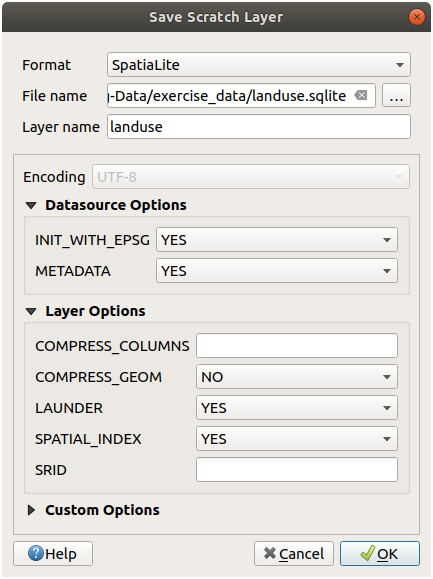
Press OK
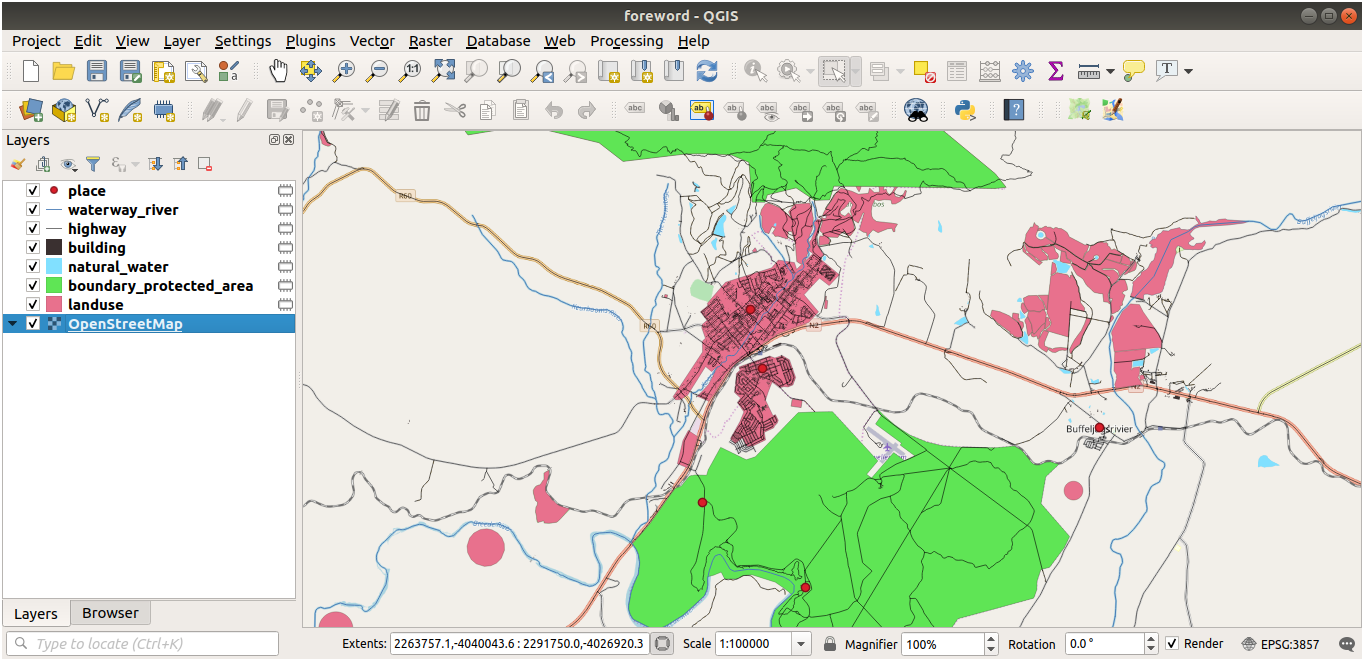
You should now have a map which looks something like this (the symbology will certainly be very different, because QGIS randomly assigns colors when layers are added to the map):
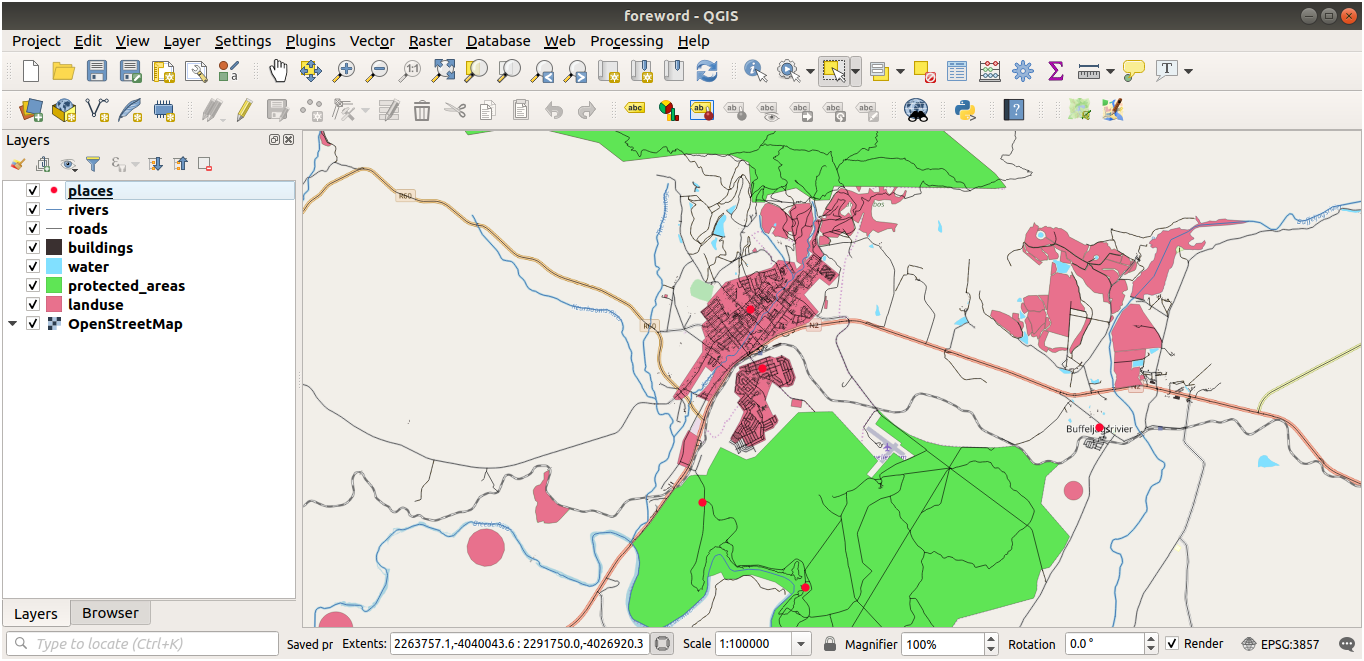
The important thing is that you have 7 vector layers matching those shown above and that all those layers have some data.
20.2. Create SRTM DEM tiff files
For modules Module: Creating Vector Data and Module: Rasters, you’ll also need raster images (SRTM DEM) which cover the region you have selected for your course.
The CGIAR-CGI provides some SRTM DEM you can download from https://srtm.csi.cgiar.org/srtmdata/.
You’ll need images which cover the entire region you have chosen to use.
To find the extent coordinates, in QGIS ,  zoom to the extent of
the largest layer and pick the values in the
zoom to the extent of
the largest layer and pick the values in the  Extents
box of the status bar.
Keep the
Extents
box of the status bar.
Keep the GeoTiff format. Once the form is filled, click on the
Click here to Begin Search >> button and download the file(s).
Once you have downloaded the required file(s), they should be saved in the
exercise_data directory, under raster/SRTM subfolders.
20.3. Create imagery tiff files
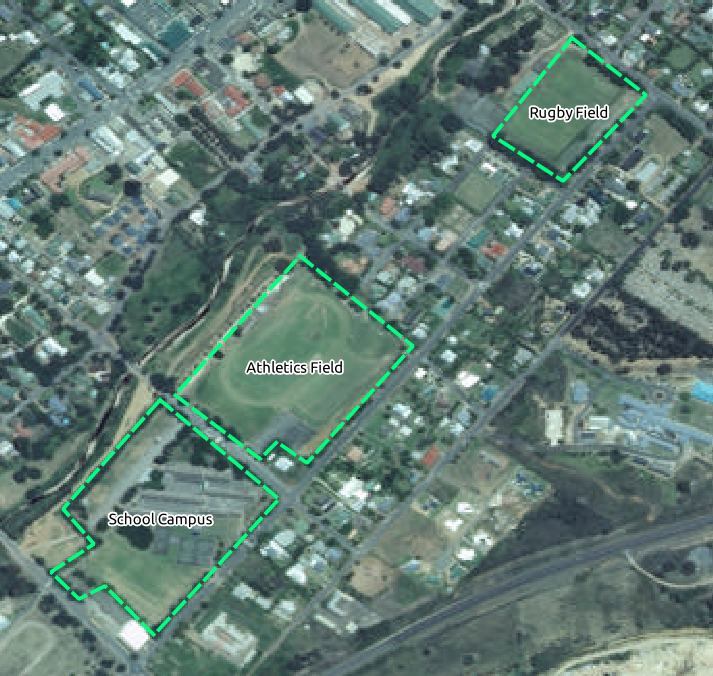
In Module Module: Creating Vector Data, ★☆☆ Follow Along: Data Sources lesson shows close-up images of three school sports fields which students are asked to digitize. You’ll therefore need to reproduce these images using your new SRTM DEM tiff file(s). There is no obligation to use school sports fields: any three school land-use types can be used (e.g. different school buildings, playgrounds or car parks).
For reference, the image in the example data is:
20.4. Replace tokens
Having created your localized dataset, the final step is to replace the tokens
in the substitutions.txt file so that the appropriate names will appear
in your localized version of the Training Manual.
The tokens you need to replace are as follows:
majorUrbanName: this defaults to “Swellendam”. Replace with the name of the major town in your region.schoolAreaType1: this defaults to “athletics field”. Replace with the name of the largest school area type in your region.largeLandUseArea: this defaults to “Bontebok National Park”. Replace with the name of a large landuse polygon in your region.srtmFileName: this defaults tosrtm_41_19.tif. Replace this with the filename of your SRTM DEM file.localCRS: this defaults toWGS 84 / UTM 34S. You should replace this with the correct CRS for your region.